Your data already
has the answer.
Learn to ask.
A practical course that turns CSV overwhelm into boardroom-quiet confidence. Real formulas. Real scenarios. Real results — in hours, not semesters.


4.9/5 from 847 reviews
Three formulas that solve
real Monday-morning problems.
Not theory. Not textbook examples. These are the formulas our students use the day after their first lesson.
INDEX-MATCH
Never get a #N/A again.
Your VLOOKUP breaks every time someone adds a column. Sales data mismatch costs you 40 minutes every Monday.
INDEX-MATCH looks up from any direction, survives column insertions, and runs 30% faster on large datasets.
=INDEX(D:D, MATCH(A2, B:B, 0))SUMIFS
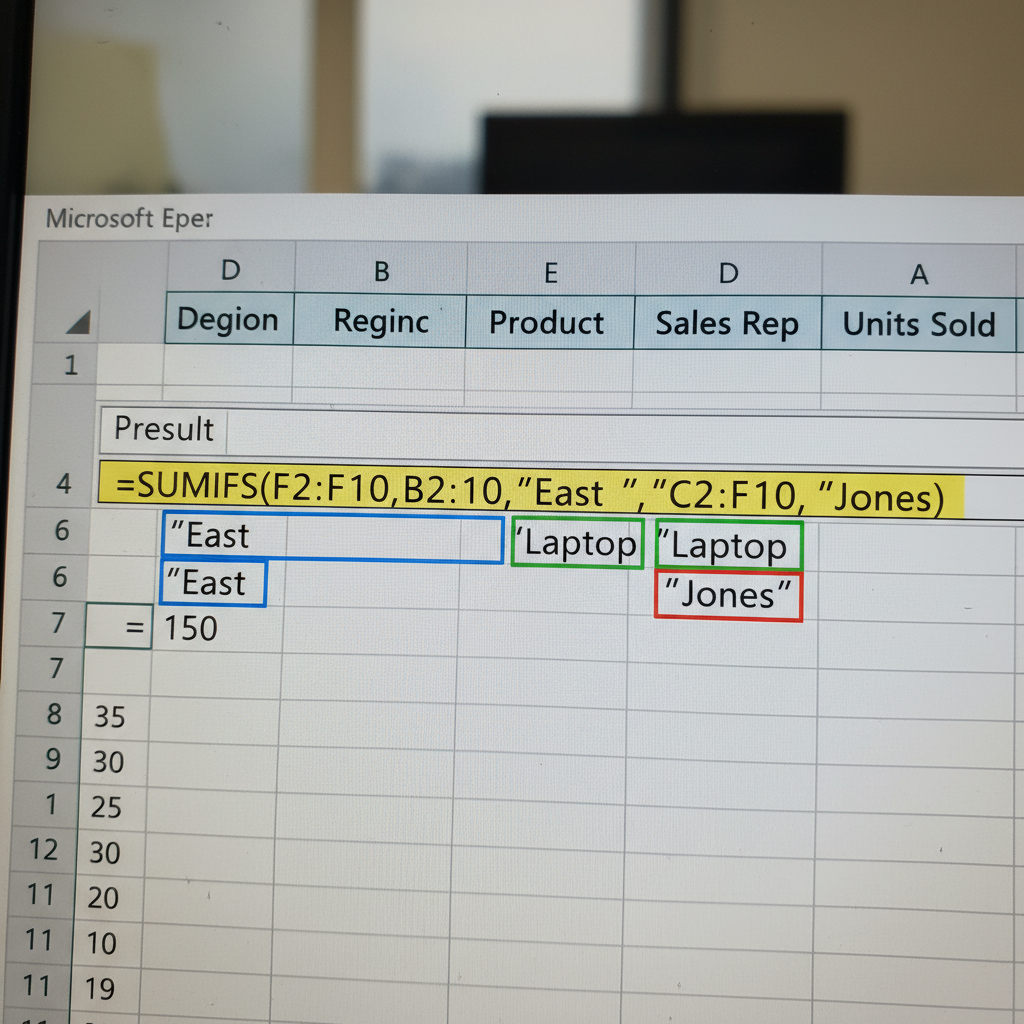
Multi-condition totals in one cell.
Your manager wants Q3 revenue broken down by region and product category. You're using 6 separate SUMIF formulas.
One SUMIFS with multiple criteria ranges. Combine with a dropdown for instant filtered totals — no pivot table needed.
=SUMIFS(Revenue, Quarter, "Q3", Region, "West")Dynamic Arrays
One formula. Entire columns.
Copying formulas down 500 rows, then updating each one when the data changes. Two hours of your Thursday, gone.
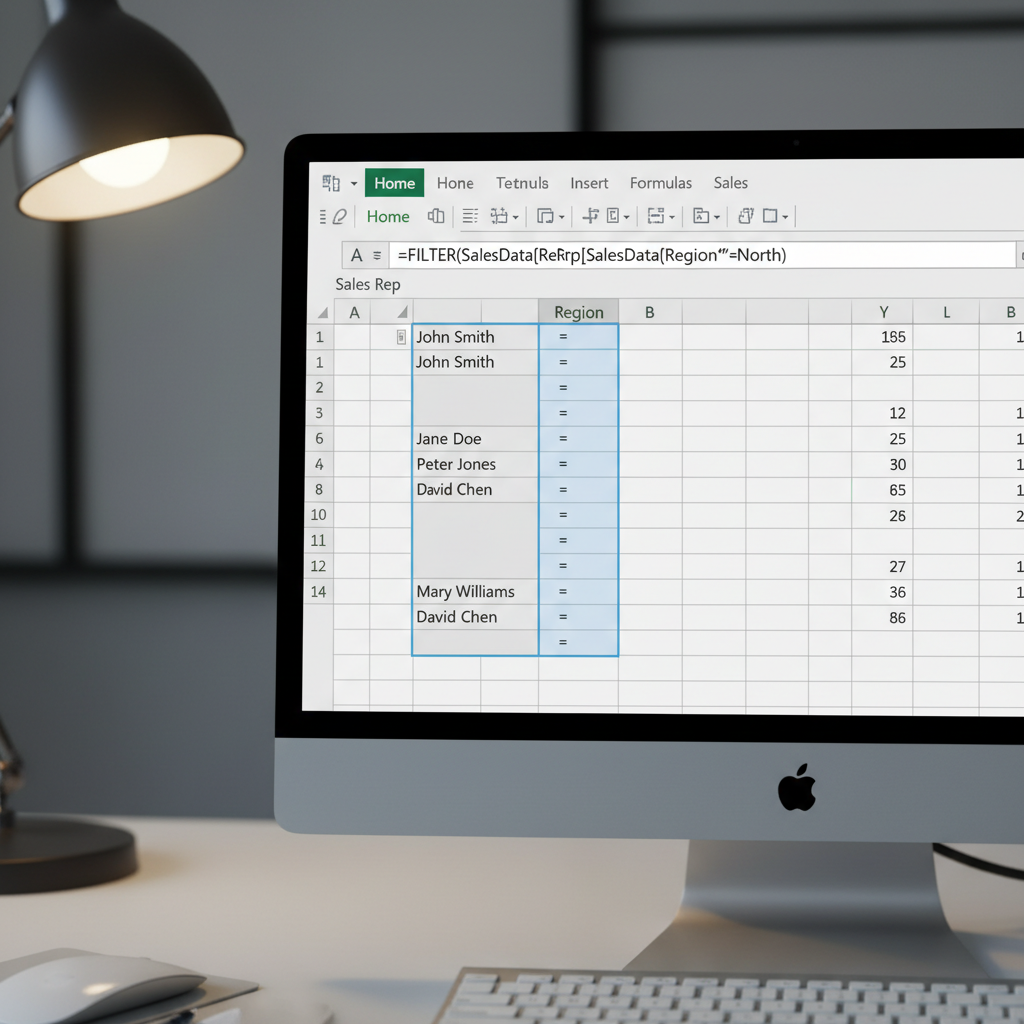
FILTER, SORT, and UNIQUE spill results automatically. Change the source data — the output updates everywhere at once.
=FILTER(A:C, B:B="Active", "No results")The cheatsheet includes 24 more formulas with real-world examples.
Download All 27 Formulas FreeFrom CSV overwhelm
to boardroom confidence.
Hover each card to see the before and after. Skills escalate as you scroll — find where you are, see where you're going.

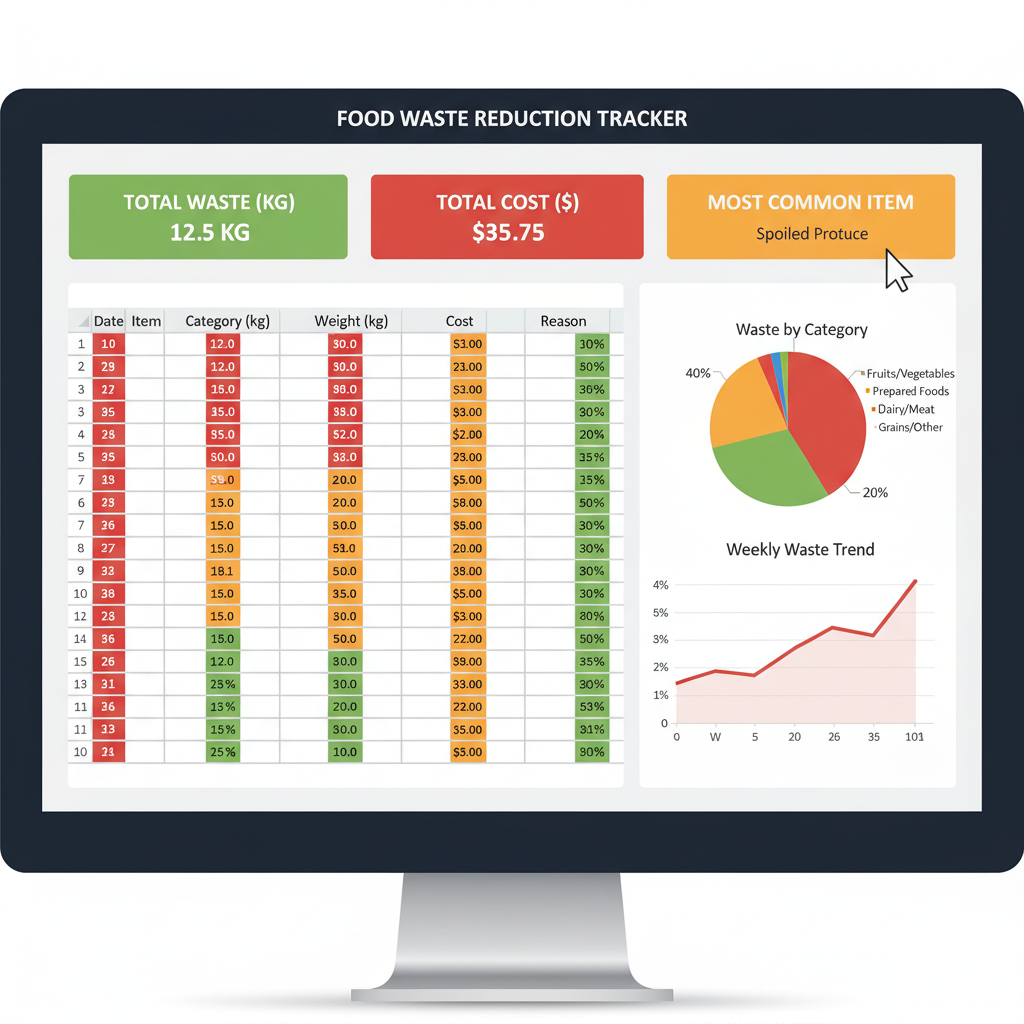
Inventory chaos
Manual counts on paper, food spoilage guesswork, end-of-week panic.
Waste tracker built in 2 hours
Conditional formatting flags items near expiry. SUMIFS calculates weekly waste cost automatically.
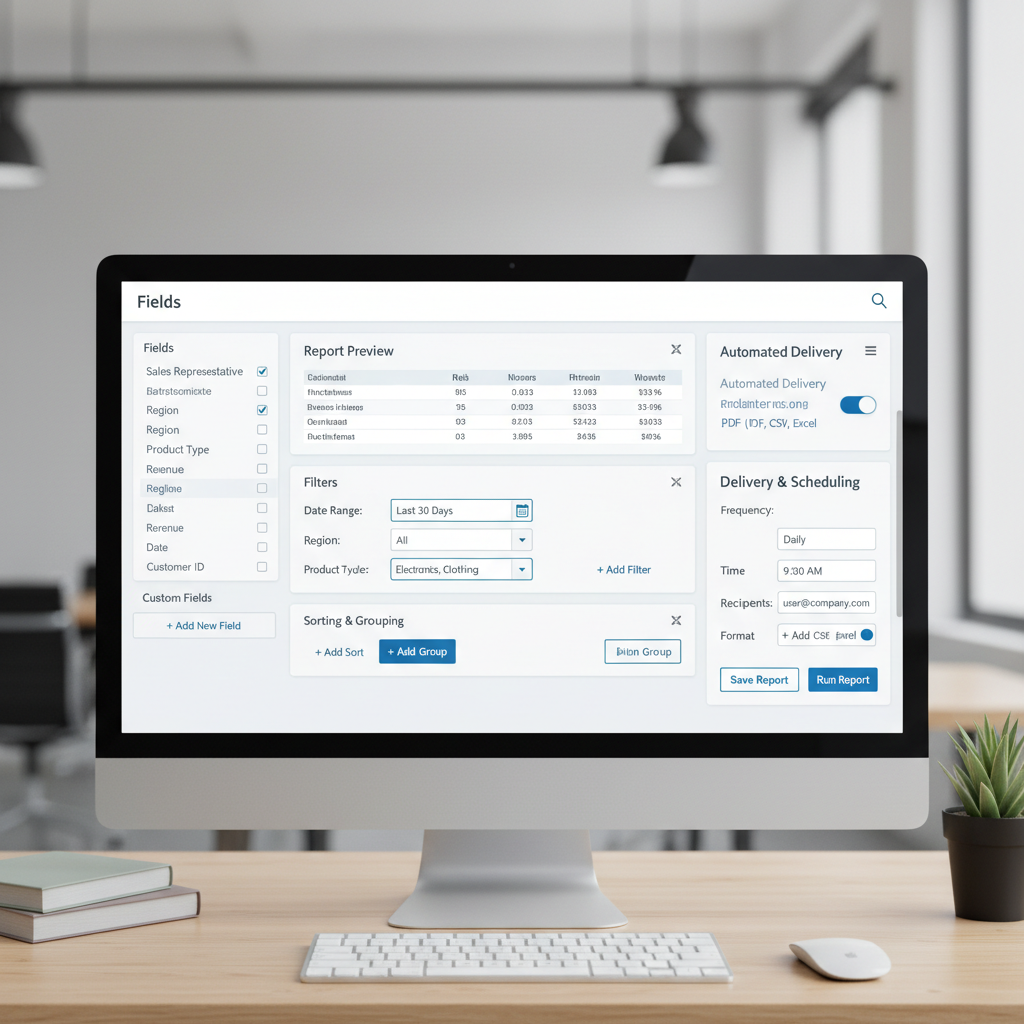

Copy-paste budget reports
Monthly budget reports took 4 hours. Copy-pasting from 6 different tabs, reformatting every time.
One-click report generation
Named ranges + INDIRECT formulas pull data automatically. The report refreshes itself.


Manual donor reports every week
Pulling donor data from 3 sources, formatting by hand, emailing to board. 11 hours every week.

Automated donor dashboard
Power Query connects to all 3 sources. Pivot tables refresh with one click. Board gets a live link.
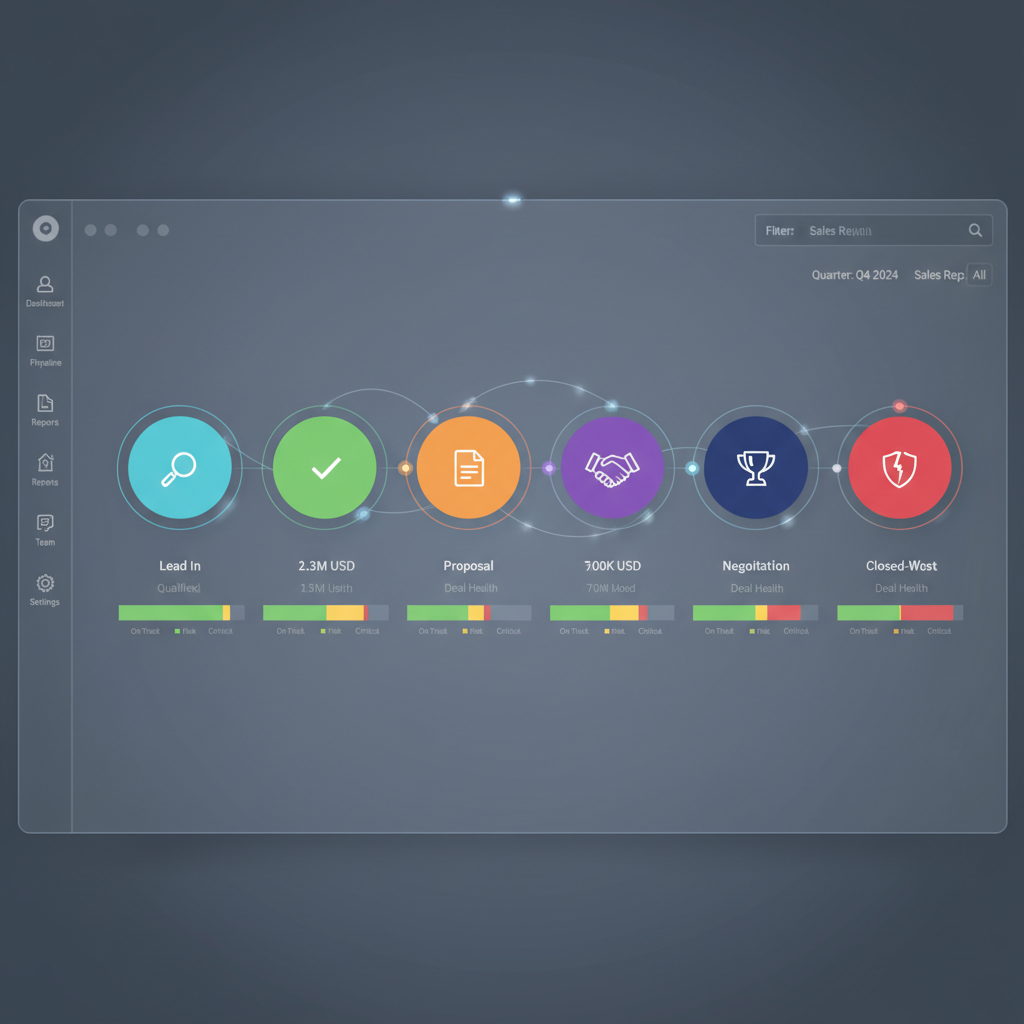
Pipeline in a flat list
CRM exports in CSV. No visibility into deal stages, no forecast model, no way to answer the VP's questions.
Live pipeline dashboard
Dynamic arrays filter by stage. SUMPRODUCT weights probability. Forecast updates as deals move.

Campaign reports in slides
Building weekly campaign reports in PowerPoint. Each slide manually updated. Meetings spent explaining the data.

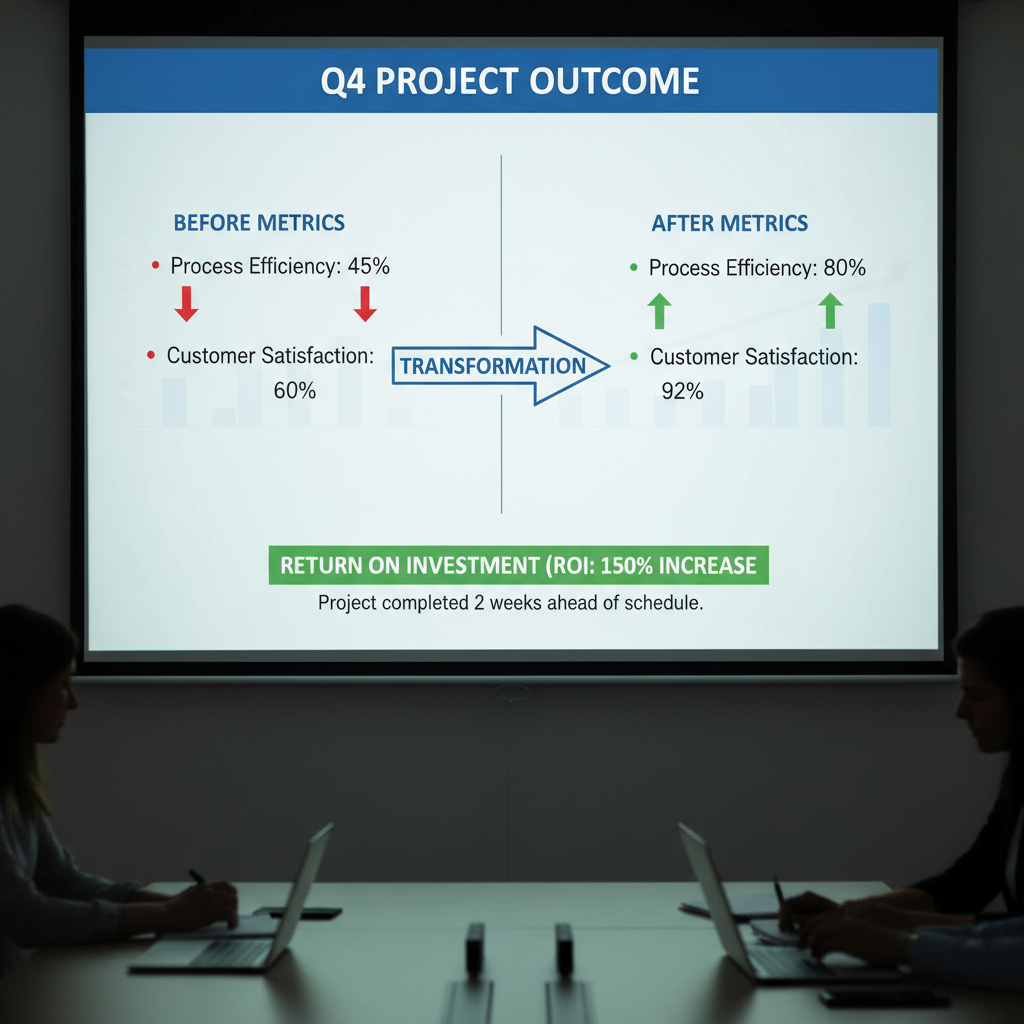
The dashboard that got her promoted
LAMBDA functions + dynamic charts. One source of truth. The CMO stopped the meeting and said "who built this?"

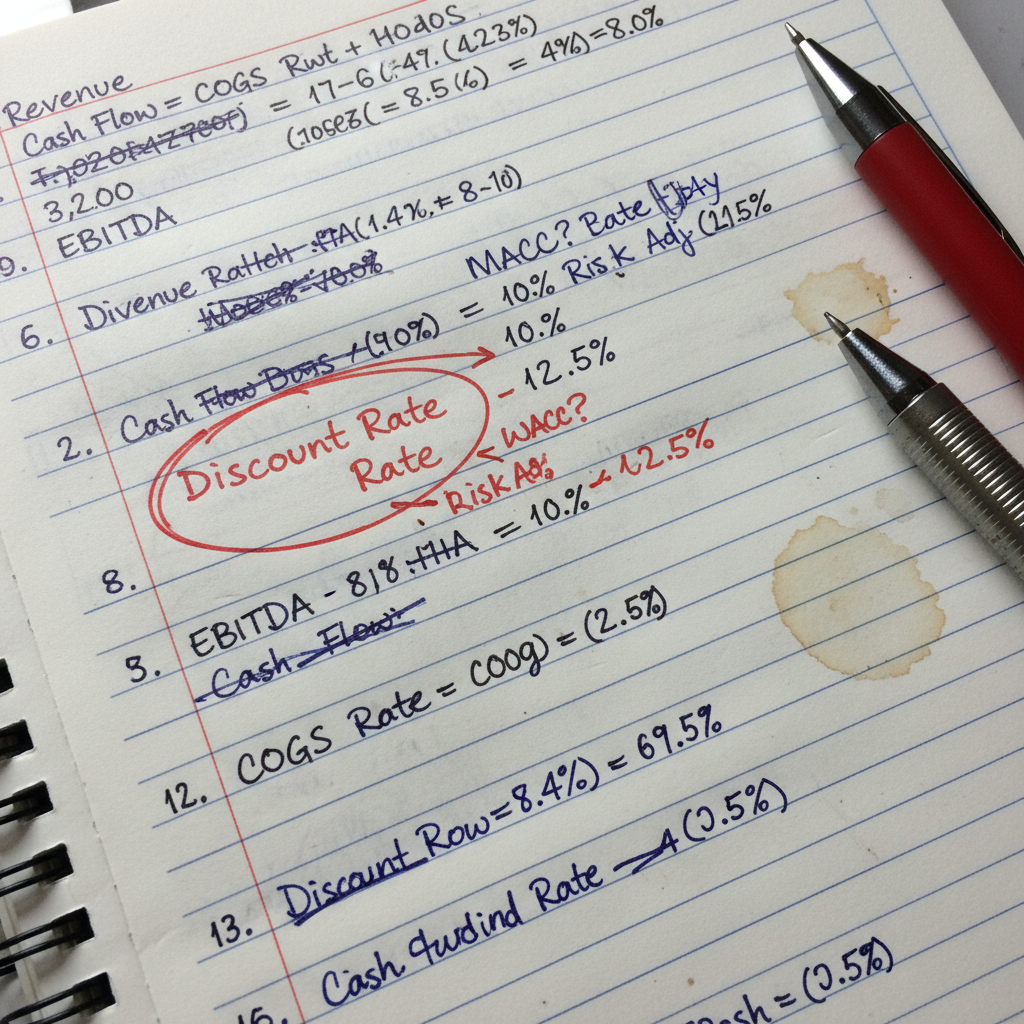
Financial model in 40 tabs
A 40-tab model built over 3 years. Nobody else could use it. Circular references nobody dared to fix.

Clean model, one tab of logic
LET and LAMBDA collapsed 40 tabs into 8. Self-documenting formulas. Board can now audit it themselves.
Which scenario is yours?
Every card above came from a student who started exactly where you are. The cheatsheet is where they all began.
Start with the free cheatsheet27 formulas.
Every one solves
a real problem.
No textbook theory. Every formula in the cheatsheet includes the exact scenario it solves, the syntax, and a one-line explanation of why it works.
INDEX-MATCHFlexible lookup from any directionSUMIFSSum with multiple conditionsXLOOKUPModern replacement for VLOOKUPFILTERDynamic filtered arrays+ 23 more...Organized by use caseGet the cheatsheet free.
No spam. One email with your download link.
2,841 analysts already downloaded this. No credit card required.
Prefer to try before you commit?
Watch the First Lesson FreeThe moment it clicks.
These are the messages we get. Specific, because the results were specific.
"I built a dashboard in my second week that my manager had been asking for for six months. She forwarded it to the VP. I'm not the same person at work."
"I used to apologize before sharing my screen. Now people ask me to slow down so they can take notes. INDEX-MATCH alone changed how my team sees me."

"The case study format made it click. I wasn't learning formulas — I was watching someone solve the exact same problem I had on my desk that morning."

Watch how a restaurant owner
cut waste by 22%
in one afternoon.
Lesson 1 is ungated. No signup required. See exactly how the course teaches — real scenario, real spreadsheet, real result.
Watch First Lesson Free — 18 minutes